Posted October 30, 2026

By Greg Guenthner
You Gotta Be Quicker Than That!
The market is toying with you.
Here we are, diving right into the uber-bullish midterm election season during a generational artificial intelligence boom… and stocks just refuse to play nice.
October has been a month full of failed breakouts and false moves.
The month started off strong as the Nasdaq Composite threatened to break higher, only to immediately reverse. It’s spent the rest of the month in correction mode, dropping as much as 7% from its Oct. 6 highs.
One day, AI stocks firm up and start to run. The next, they roll over as skittish traders ditch them for healthcare names.
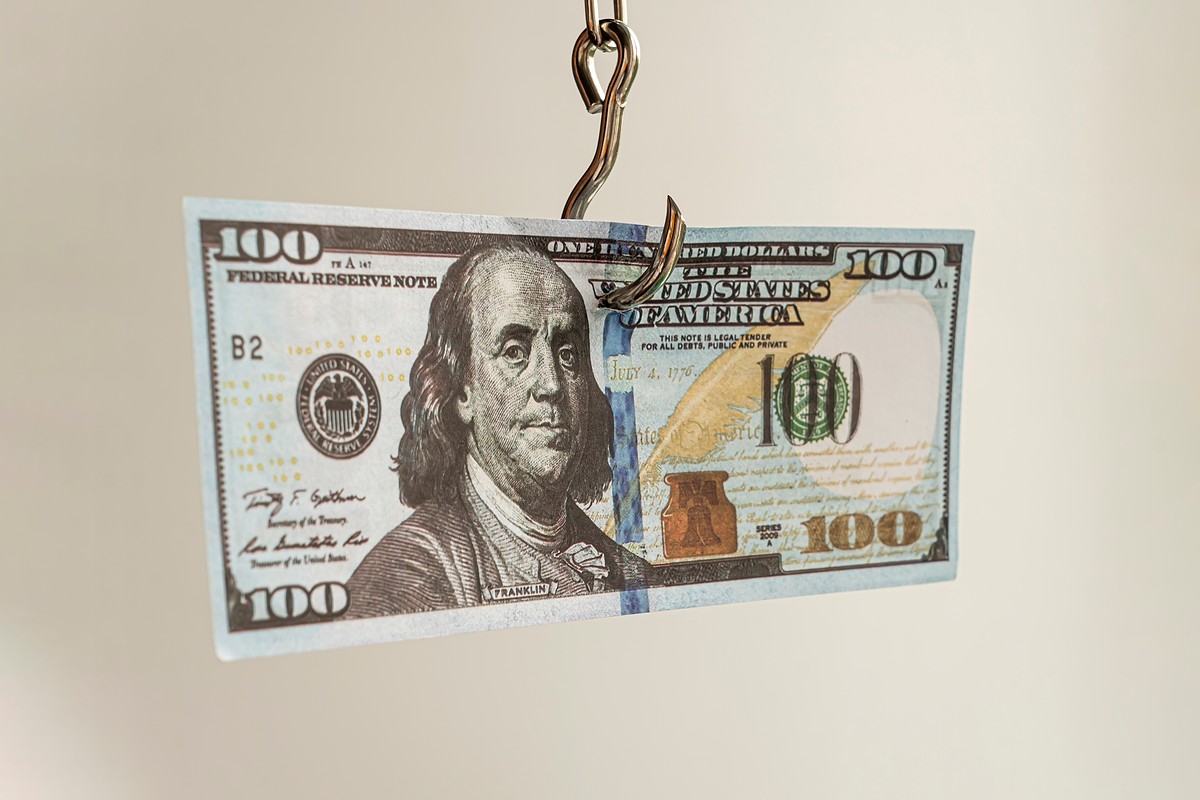
The market’s dangling money right in front of our faces, only to yank it away at the last second like the old fisherman from those State Farm commercials…

“I got you a dollar. You gotta be quicker than that!”
Yes, seasonality is bullish. And I’d love a nice post-midterm melt-up rally to help us finish the year strong. But hopes and dreams aren’t going to help us rake in any trading gains.
Instead of trading the markets based on what we want to happen, let’s remove the tickers and blindly analyze the next three charts.
The purpose of this exercise isn’t to guess the stock before I reveal it.
Take the time to figure out whether you would buy, sell, or do nothing — without knowing what you’re looking at.
This is the art of chart reading. Let's dive in…
Chart No.1: A buy-the-dips opportunity?
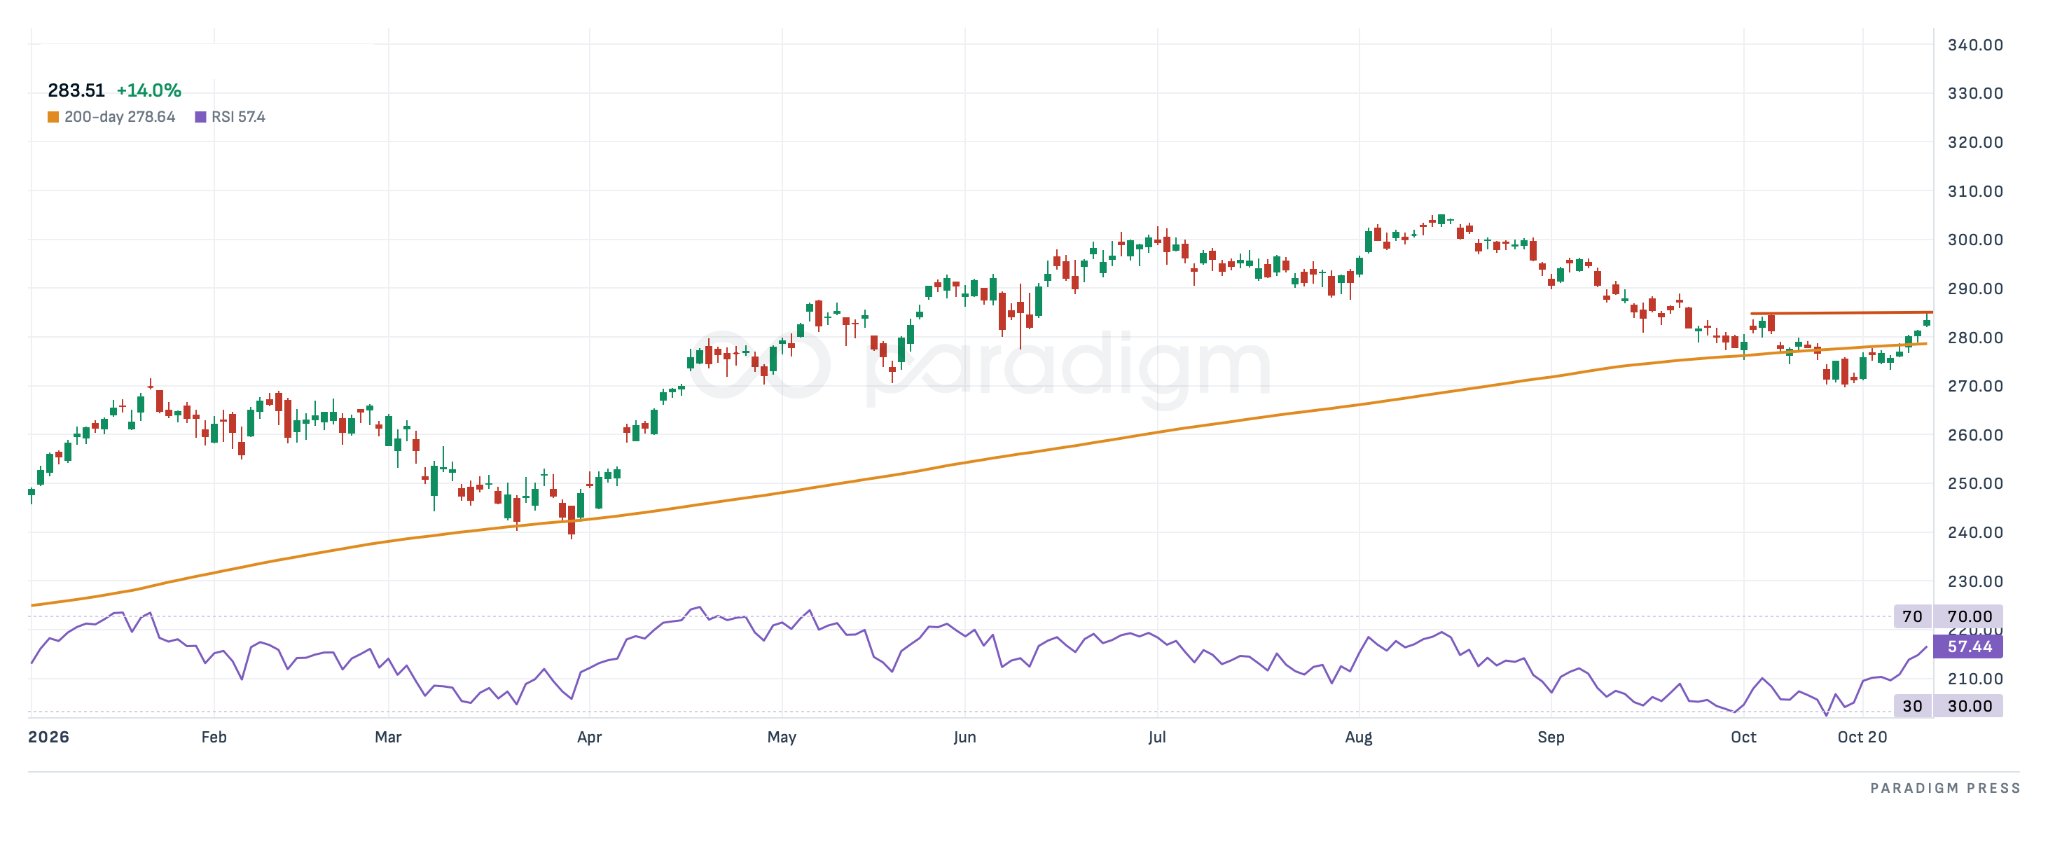
Here we have a name that’s just recently undercut its 200-day moving average (orange line) and has rallied back toward its early October highs.
You can clearly see the move to new year-to-date highs back in August, followed by a quick correction that picked up steam in September.
But unlike many of the bigger tech names, this name has rallied more than 5% over the past two weeks and is now knocking on the door of a bigger breakout if it can cross above $285 (red horizontal line).
Rapidly improving momentum (as measured by RSI at the bottom) is also notable here, as this name is posting its highest RSI reading since its August highs, suggesting the start of a more bullish momentum regime this week.
I’m a buyer if we see a clean break above $285, with an aggressive target of $300 and new 2026 highs.
Chart reveal: iShares Russell 2000 Index Fund (IWM).
Comments: Small-caps could be a great place to look for gains in November, especially if the bigger chip stocks continue to underperform.
Chart No.2: Choose your own adventure
Here’s an interesting situation…
We have a stock that enjoyed an amazing run back in the second quarter. But it hasn’t been able to recapture the magic that helped it rally from $450 to more than $1,000 in a matter of months.
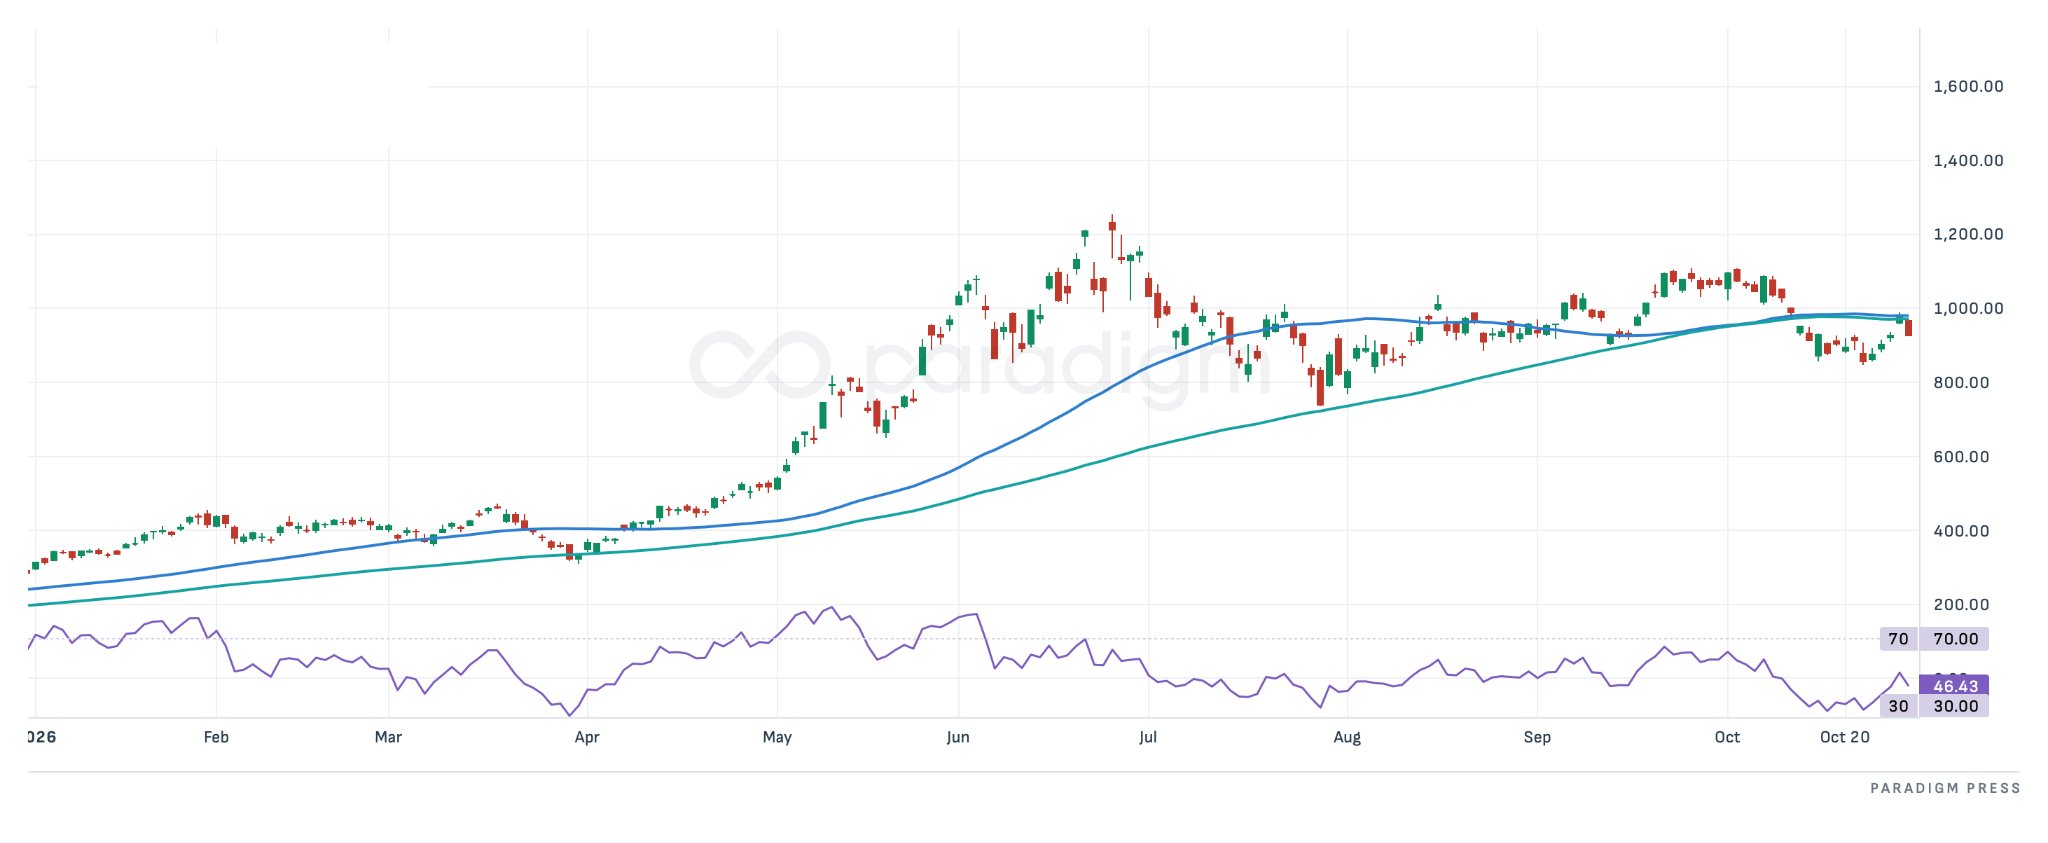
The big issue here is the stock has refused to break down so far. Instead of completely falling apart, it’s teased the bulls and bears alike with more than a few false moves since the late summer. Shares broke back above $1,000 in September, only to roll over earlier this month.
Just yesterday, the stock failed to retake its 50- and 100-day moving averages following a strong four-day rally. Back in the chop it goes…
As for which action to take, I’m afraid this is a “no touch” for me. I’d get more bullish if it broke back above $1,000. Conversely, it might be time to get short if it can’t hold onto its swing lows near $850.
Chart reveal: Micron Technology Inc. (MU)
Comments: This crowded trade might be an obvious chart that you guessed right away. But there’s no denying how important the DRAM stocks have been during this year’s rally. Time will tell if the rest of the tech sector can continue to march higher without this popular chip stock participating.
Chart No.3: Fake it ‘til you make it
I’m always paying close attention to charts that are near important inflection points, and this next example is no exception.
This name enjoyed a strong run-up April-June, but subsequently gave back every cent of those gains by the end of the summer.
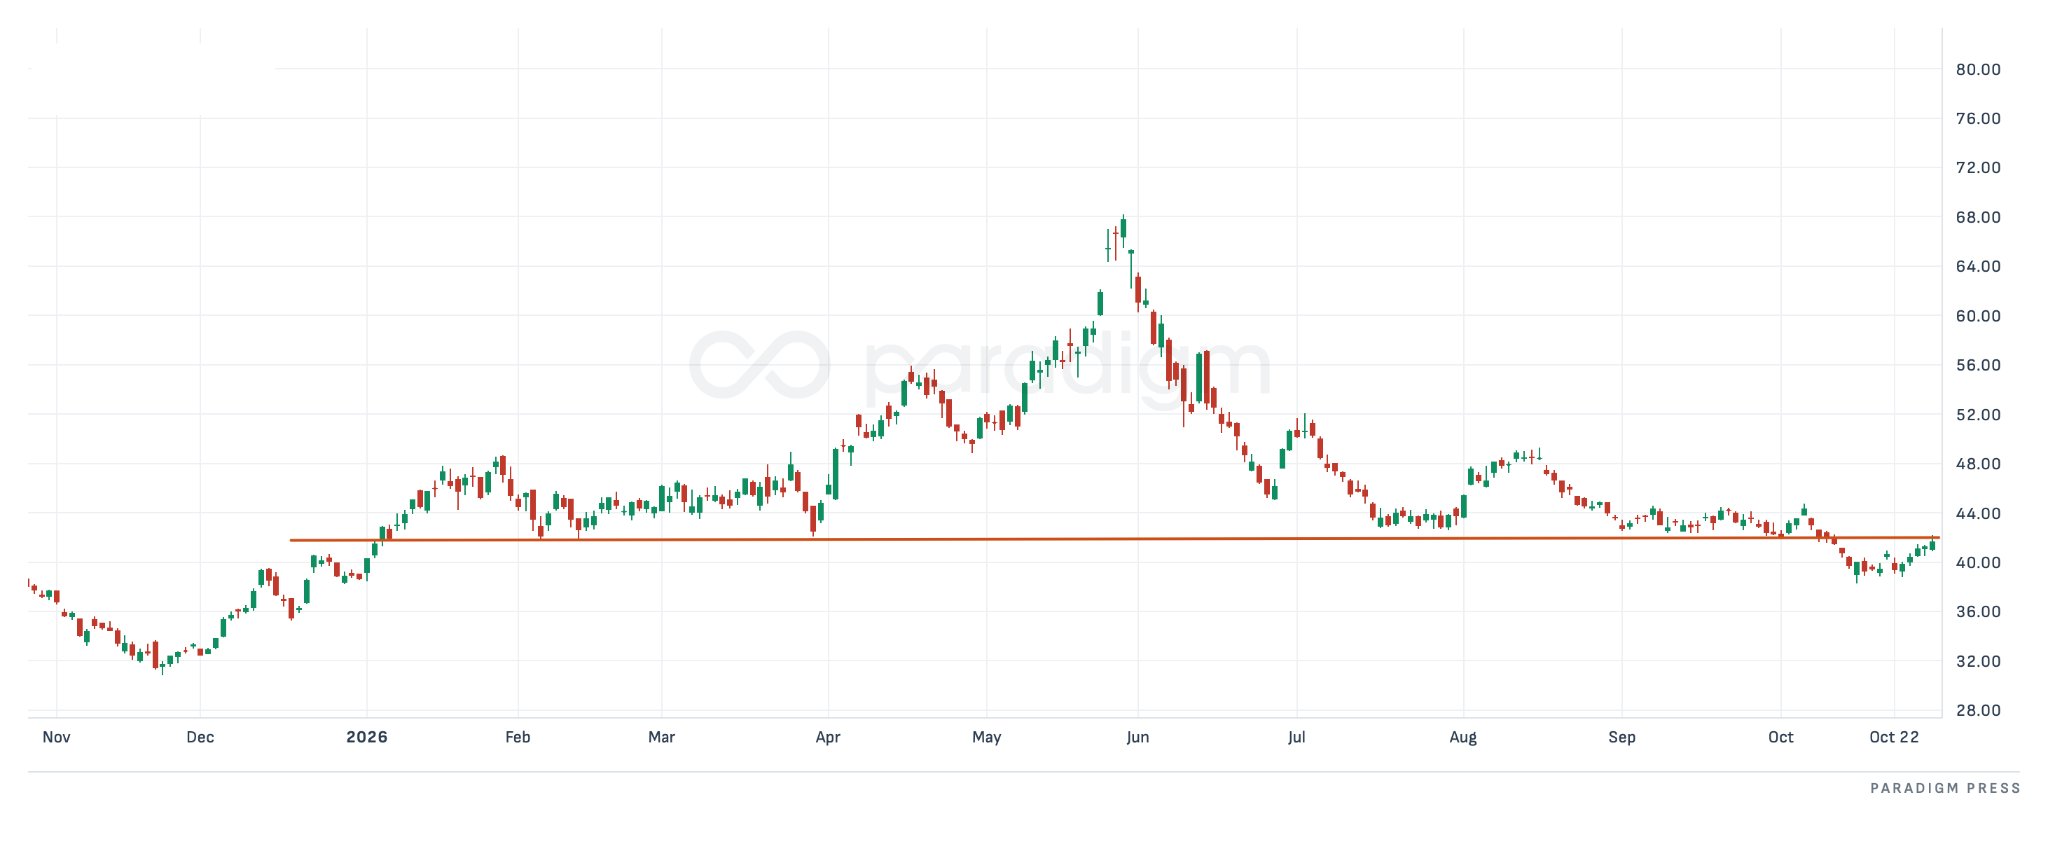
To make matters worse, this name broke to new year-to-date lows earlier this month. That’s our line in the sand (red horizontal line).
As you can probably imagine, most of the bulls have probably been scared out of this name over the past five months. Therein lies the potential opportunity…
Take a look at the action in this name over the past week. Price has snuck higher for five straight days. It even managed to rally nearly 1% on Thursday while the Nasdaq dropped more than 1.6%.
Because of this recent bullish action, I’m putting this name on failed breakdown watch. If this name can push back above our line ~$43, we could see a massive rally as sold-out bulls begin to chase. From failed moves come fast moves in the opposite direction!
Chart reveal: Procure Space ETF (UFO)
Comments: Space stocks came back to Earth following the hype of the SpaceX ETF. But the group is showing signs of life as November approaches. Keep your favorite space stock on failed breakdown watch heading into next week!
Sign Up Today for Free!
Truth & Trends brings you market insights and trading tips you won't find anywhere else — unless you have your own personal hedge fund manager on speed dial...
Meet Enrique Abeyta, one of Wall Street’s most successful hedge fund managers. With years of experience managing billions of dollars and navigating the highs and lows of the financial markets, Enrique delivers unparalleled market insights straight to your inbox.
In Truth & Trends, Enrique shares his personal take on what’s moving the markets, revealing strategies that made him a star in the world of high finance. Whether it’s uncovering the next big trend or breaking down the hottest stocks and sectors, Enrique’s insights are sharp, actionable, and proven to work in any market condition.
Inside these daily updates, you’ll gain:
- 50 years of combined trading wisdom distilled into actionable insights.
- A behind-the-scenes look at how Wall Street pros spot opportunities and avoid pitfalls.
- Exclusive strategies that Enrique personally uses to deliver exceptional returns — no fluff, just results.
To have Truth & Trends sent directly to your inbox every weekday, just enter your email address below to join this exclusive community of informed traders.
Don’t miss your chance to learn from one of the best in the business.
Sign up now and take your trading game to the next level.
NVIDIA: The Biggest Stock Massacre in History
Posted October 29, 2026
By Enrique Abeyta

5 Ways to Play Amazon's Earnings (I Made My Bet)
Posted October 28, 2026
By Zach Scheidt

The Calendar Turns Bullish
Posted October 27, 2026
By JC Parets

6 Stages of a Credit Bubble: From Mania to Meltdown
Posted October 26, 2026
By Enrique Abeyta

You’re Not Crazy. This Market Action Stinks!
Posted October 23, 2026
By Greg Guenthner