
Posted October 13, 2025

By Enrique Abeyta
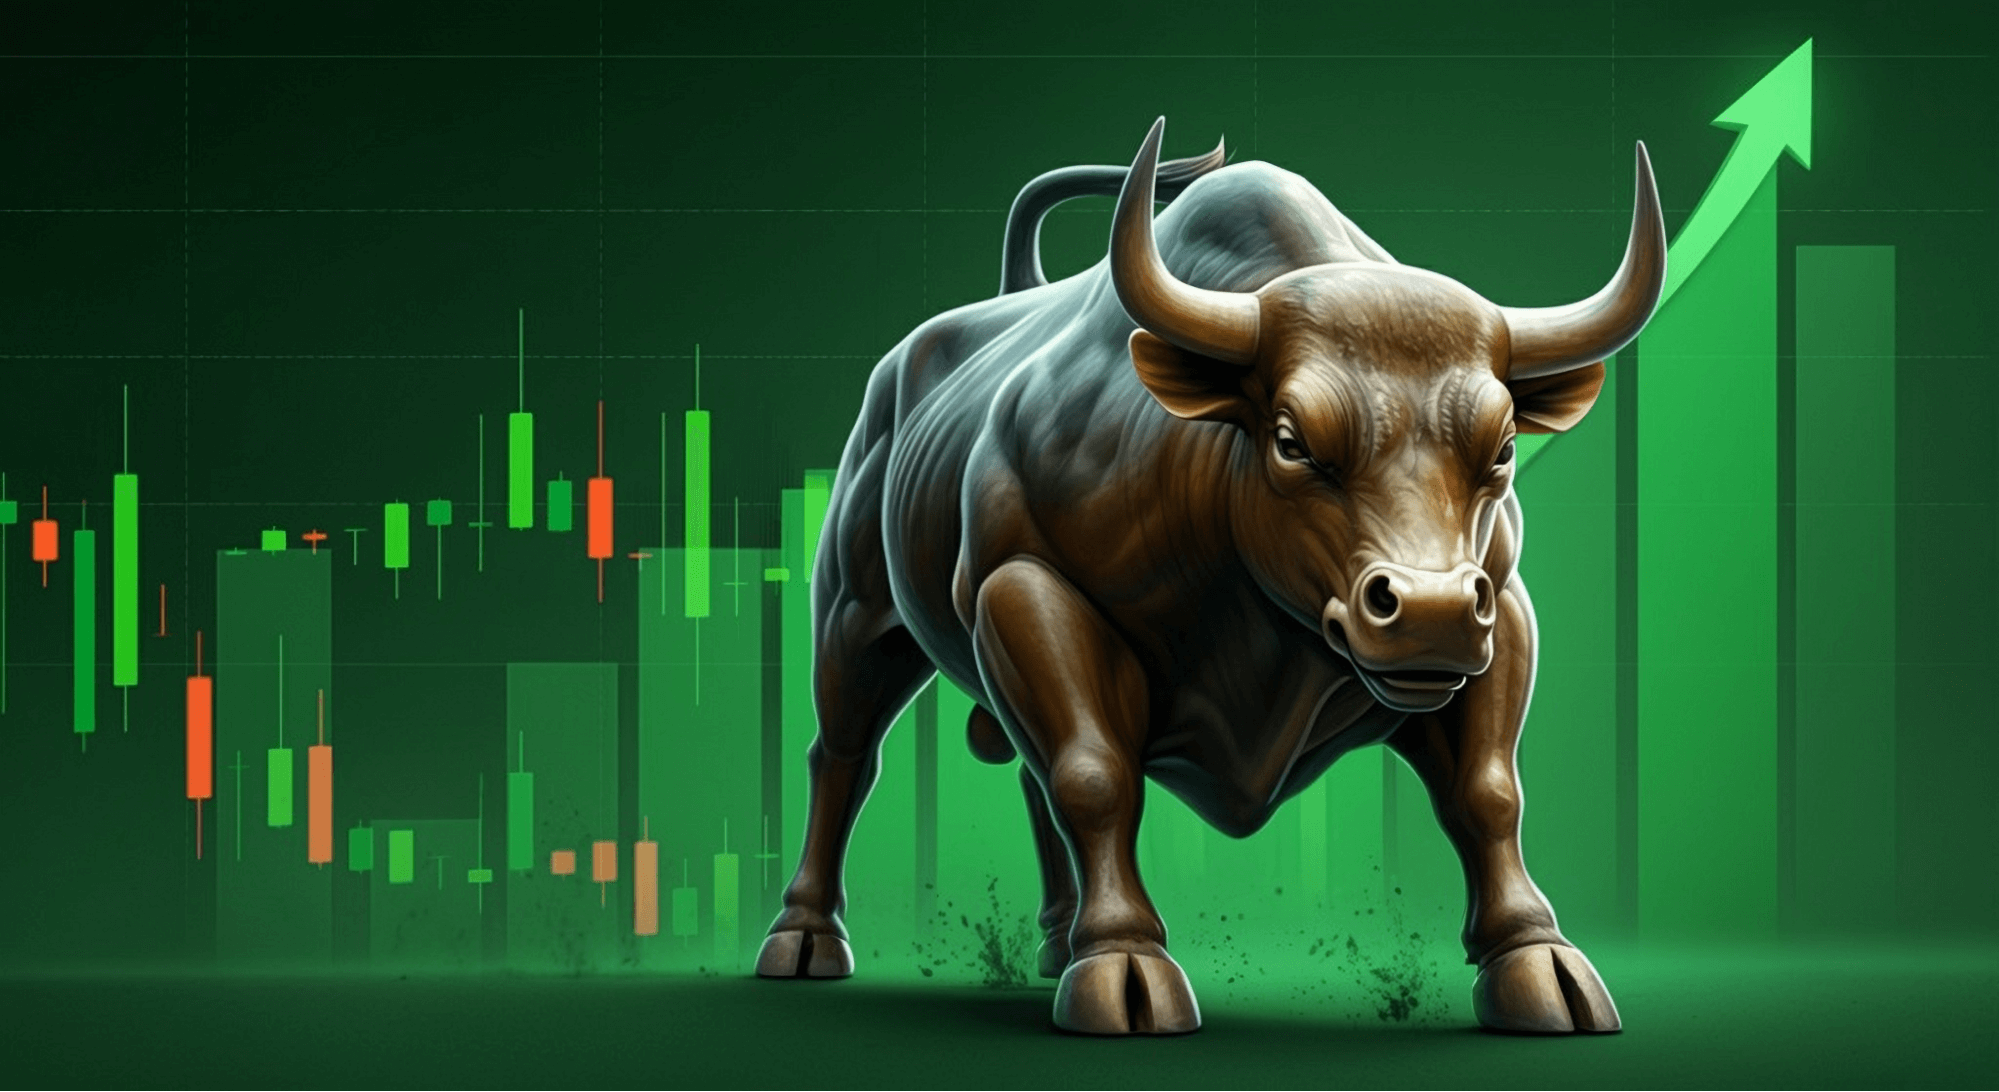
Everyone Loves the Rally…. Except the Data
As you’ve heard by now, Trump threatened to slap massive tariffs on China late last week.
The U.S. stock market dropped immediately after Trump’s post and continued to fall throughout the afternoon.
Friday ended up being the single largest one-day decline since the selloff in April after the"Liberation Day" tariffs.
What made the drop even more surprising was how strong the market had been up until then, notching new highs without looking back.
Stocks rebounded today after Trump downplayed the tension and said it “will all be fine!”
Now, I ordinarily advise that you tune out this kind of noise. But it brings up an important question.
If one social media post can send this bull market reeling, is it really that strong after all? The data says maybe not.
Early Warning Signs Are Flashing
Stocks have been on a hot streak for the past few months. But when you look at the data, a few key indicators are starting to show cracks in the foundation.
The McClellan Summation Index, a widely followed measure of breadth, has flattened and drifted lower over recent weeks, even as the major indices made new highs.
That divergence often indicates that fewer stocks are doing the heavy lifting.
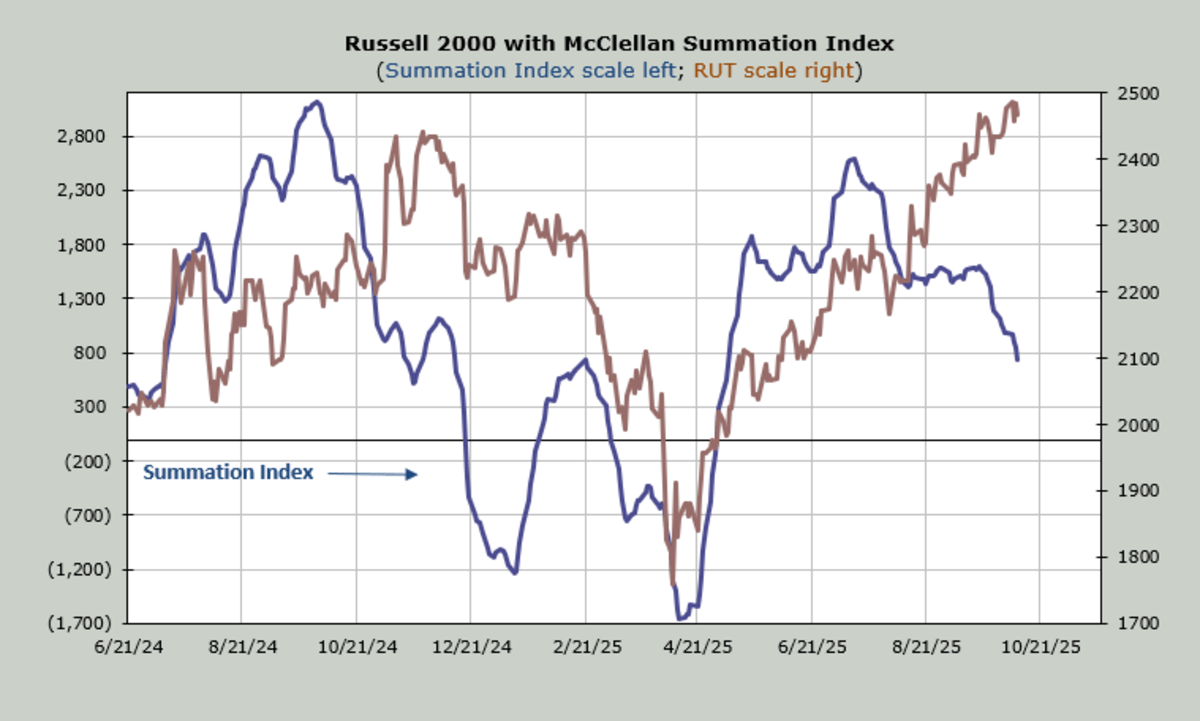
Breadth data from the NYSE paints a similar picture.
Out of roughly 3,000 listed stocks, only two of the past 10 sessions have seen more than a thousand names making new highs, a surprisingly weak showing during a record-setting run.
Over that period, breadth was positive on just five days and negative on five, indicating that participation has narrowed considerably.
Perhaps one of the clearest warning signs has been the underperformance of quality stocks.
Below is a chart that compares the S&P Quality ETF to the broader S&P 500, showing a sharp decline over the past month.
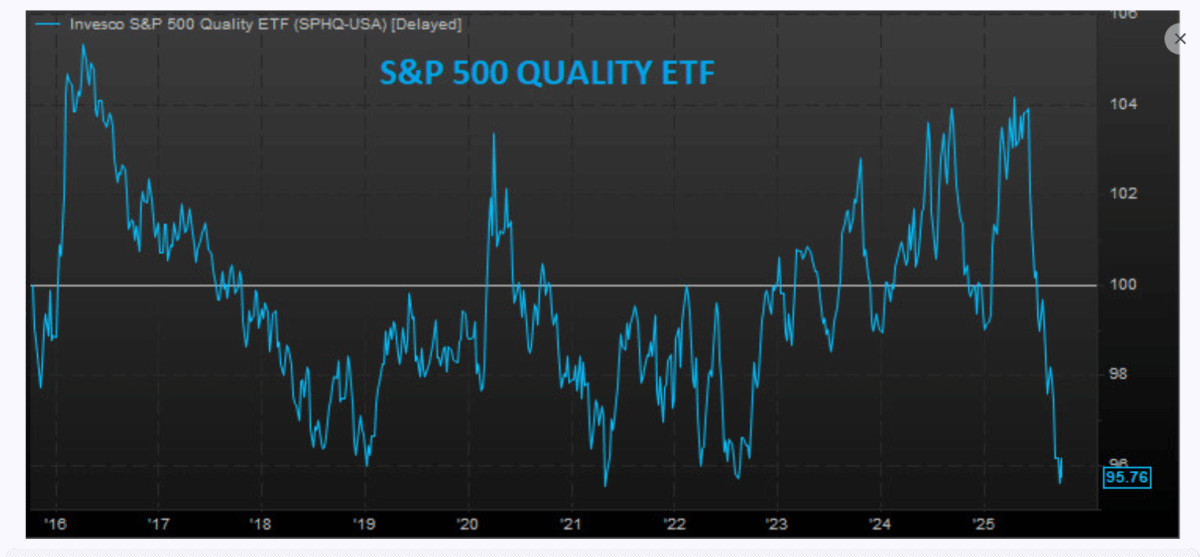
This suggests that investors have shifted away from companies with strong fundamentals and into more speculative corners of the market.
Small-cap data underscores this shift.
According to Bloomberg data, only 57% of Russell 2000 companies are currently profitable, while 41% are not.
Since April’s lows, the profitable group has gained 22%, while the unprofitable stocks have surged 53%.
That imbalance is not the hallmark of a fundamentally driven rally.
Money has rotated between groups — restaurants, asset managers, homebuilders, and then back into mega-caps.
This activity is keeping the major averages afloat, but the narrowing leadership and speculative rotation typically don’t last forever.
The rally's foundation remains shaky without broader participation and renewed strength from quality names.
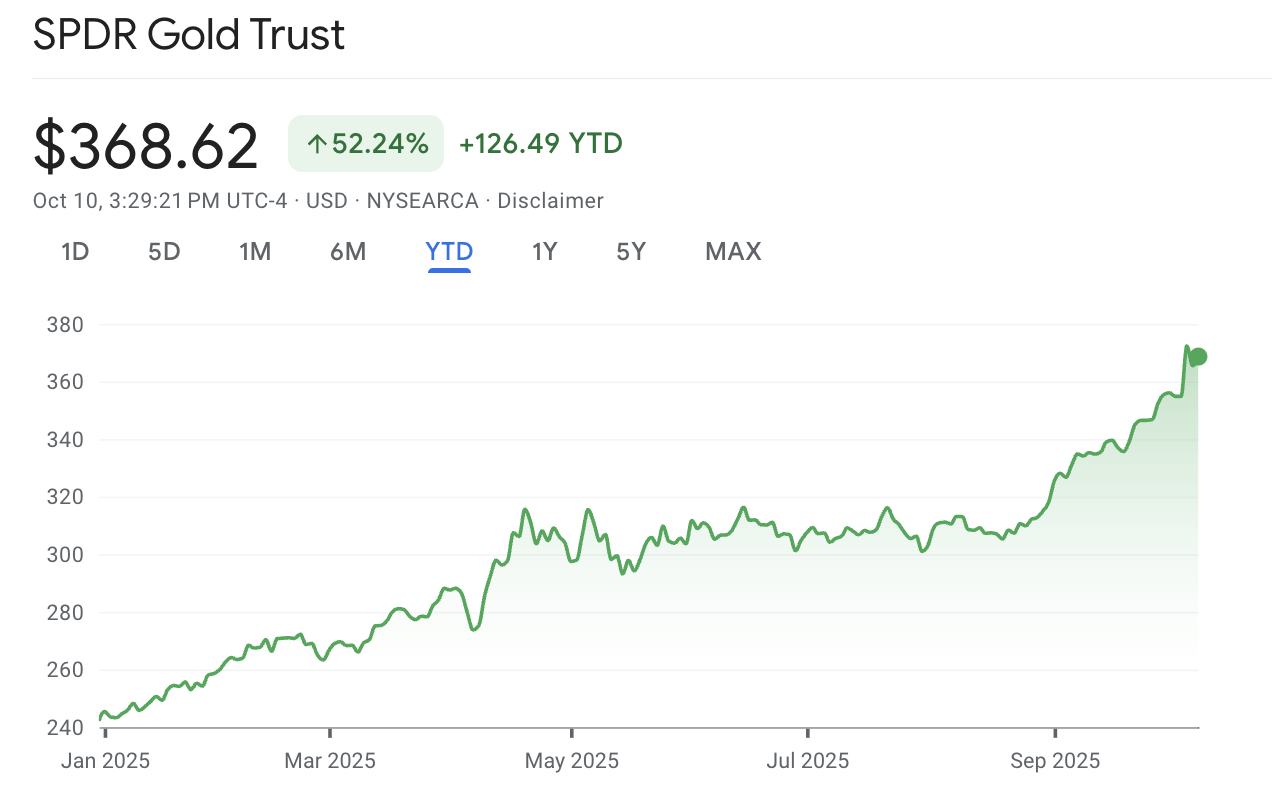
And as the rotation goes on, retail and professional investors alike plow money into increasingly speculative stocks, while precious metals and crypto are also trading near all-time highs.
If you were to take 10 minutes to scroll through investing-related feeds on X, you would observe signs of market euphoria.
Online chatter around the Mag 7 and other companies with strong fundamentals is drowned out by speculative AI trades and astronomical gains from stocks you've never heard of.
What Does It All Mean?
On the surface, the market still looks healthy. However, the underlying structure is weakening.
Breadth is narrowing, quality is lagging, sentiment is overheated, and speculative behavior is rising.
While none of this promises a major pullback tomorrow, it does suggest that the rally everyone loves is increasingly out of step with the data.
I’m not raising a red flag yet. But staying disciplined and watching these indicators closely may prove crucial in the weeks ahead.
Because, in the end, it's not about how much money you make, it's how much you keep.
Sign Up Today for Free!
Truth & Trends brings you market insights and trading tips you won't find anywhere else — unless you have your own personal hedge fund manager on speed dial...
Meet Enrique Abeyta, one of Wall Street’s most successful hedge fund managers. With years of experience managing billions of dollars and navigating the highs and lows of the financial markets, Enrique delivers unparalleled market insights straight to your inbox.
In Truth & Trends, Enrique shares his personal take on what’s moving the markets, revealing strategies that made him a star in the world of high finance. Whether it’s uncovering the next big trend or breaking down the hottest stocks and sectors, Enrique’s insights are sharp, actionable, and proven to work in any market condition.
Inside these daily updates, you’ll gain:
- 50 years of combined trading wisdom distilled into actionable insights.
- A behind-the-scenes look at how Wall Street pros spot opportunities and avoid pitfalls.
- Exclusive strategies that Enrique personally uses to deliver exceptional returns — no fluff, just results.
To have Truth & Trends sent directly to your inbox every weekday, just enter your email address below to join this exclusive community of informed traders.
Don’t miss your chance to learn from one of the best in the business.
Sign up now and take your trading game to the next level.
The Leverage Trap: A Painful Lesson in Risk
Posted October 17, 2025
By Greg Guenthner

4 Hard Truths for a Parabolic Market
Posted October 16, 2025
By Enrique Abeyta

How to Handle a Bubble — You Have Four Options
Posted October 09, 2025
By Enrique Abeyta
5 Charts Prove This Bull Has Legs
Posted October 06, 2025
By Enrique Abeyta

The “Forgotten Stepchild” Precious Metal Is Waking Up
Posted October 05, 2025
By Ian Culley