Posted October 06, 2025

By Enrique Abeyta
5 Charts Prove This Bull Has Legs
In theory, the calendar should have no effect on the stock market’s performance. In practice, however, it absolutely does.
The idea that the stock market tends to follow certain patterns at specific times of the year is known as seasonality.
Some may write it off as pure superstition. But there are often good reasons why stocks follow seasonal patterns each year.
Here’s just one example…
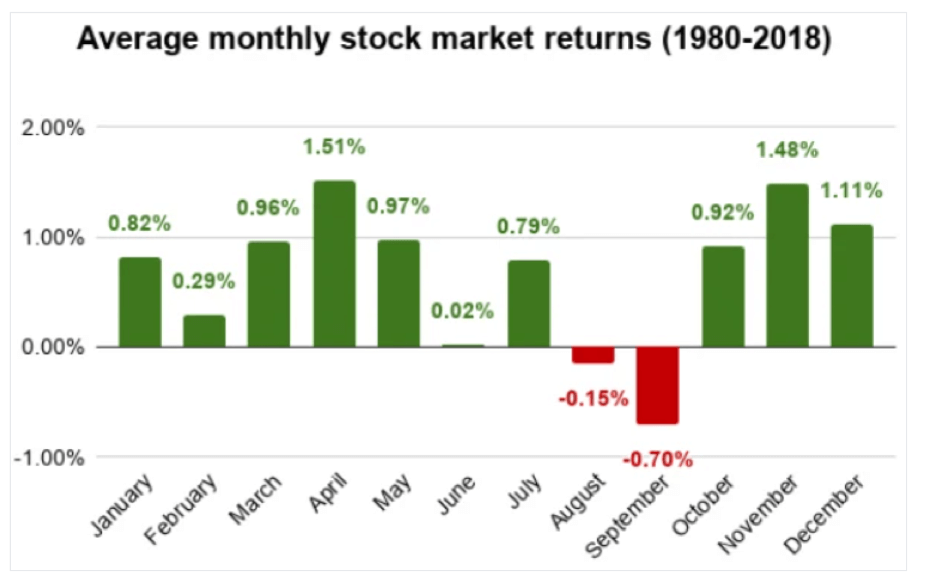
Companies report their results quarterly. After the third quarter, they have less time to make up for disappointing numbers.
If management teams realize they won’t meet full-year targets, they often preview that news in September. That’s a big reason why the month has a reputation for weakness.
You can see in the chart below that September is typically the S&P 500’s worst month — by quite a wide margin.
But seasonal trends are all about probability, not certainty.
This year, the S&P 500 avoided the usual drawdown and actually gained about 3.5% in September.
That kind of strength in September may be rare. But history tells us that when it does happen, stocks tend to end the year even higher.
Today, I’ll show you five charts that lay it all out.
Why 2025 Could End With a Bang
The fourth quarter of the year is when seasonal trends are at their strongest.
Below are two charts from Bespoke Investment Group, showing the average market return by quarter and how often the market ends each quarter positive.
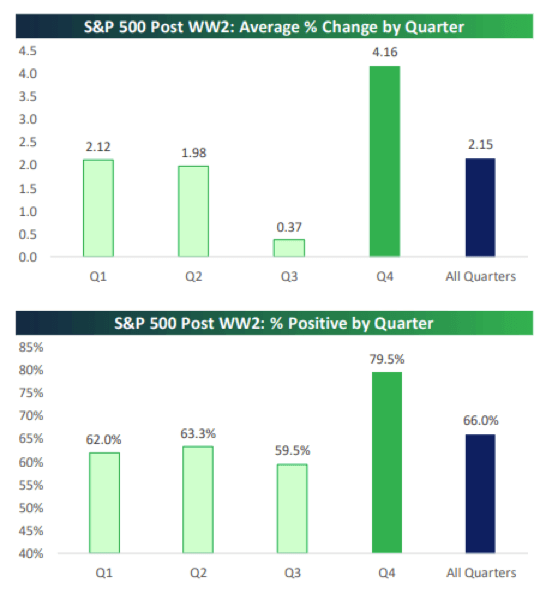
Source: Bespoke Investment Group
You can see that since World War II, the S&P 500 has been up almost double the average for all quarters and positive almost 80% of the time.
Those are both strong returns and a high probability of a positive outcome.
I already explained why the end of Q3 is known for weakness. Now, why is Q4 associated with strength?
Well, one reason is that most professional money managers are compensated based on their performance at the end of the calendar year.
So they will do everything they can to see the market go higher by year-end.
If a money manager is flat (or down) going into year-end, then they probably won’t be aggressive. A money manager who’s up double digits, on the other hand, will buy every dip.
Here are two tables that show how the stock market has performed in Q4 when it’s up going into the quarter (compared to down).
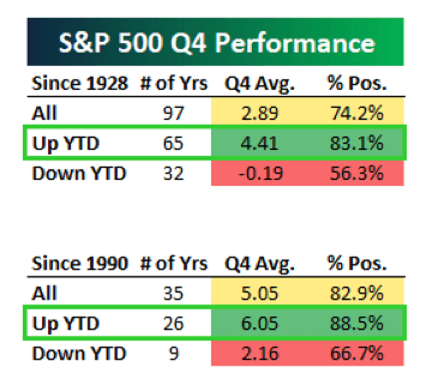
Source: Bespoke Investment Group
These are some remarkable numbers that prove my point from above.
Since 1928, if the S&P 500 is up at the end of Q3, then the stock market is up 4.4% in Q4 — and up more than 83% of the time.
As you can see, the numbers are even stronger after 1990.
Here’s another chart showing how the stock market has done after it hits new highs in October.
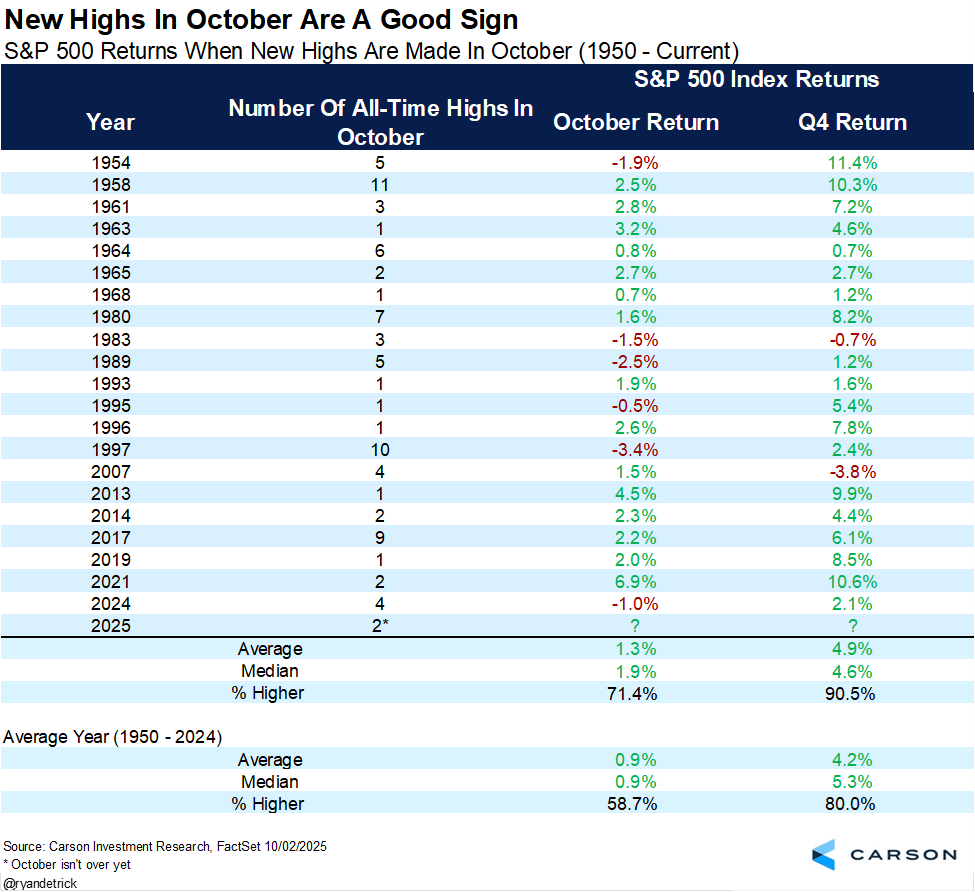
Source: Carson Investment Research
The stock market is up 90% of the time since 1950 and up an average of almost 5%. This speaks to the powerful forces of positive momentum and seasonality.
All this being said, the strength of the stock market and economic data has now pushed sentiment towards the high end of the spectrum.
Too many people on one side of the boat leaves it vulnerable if it hits even a small stone in the river.
That’s where we are right now, which is why I am cautious in the near term (think weeks). So take profits when you have them.
But looking further out through the fourth quarter, I am BULLISH on the stock market. There is an extremely high probability that we finish 2025 strong.
And over the next year? Here’s a final bonus chart that shows this bull market still has plenty of room to run.
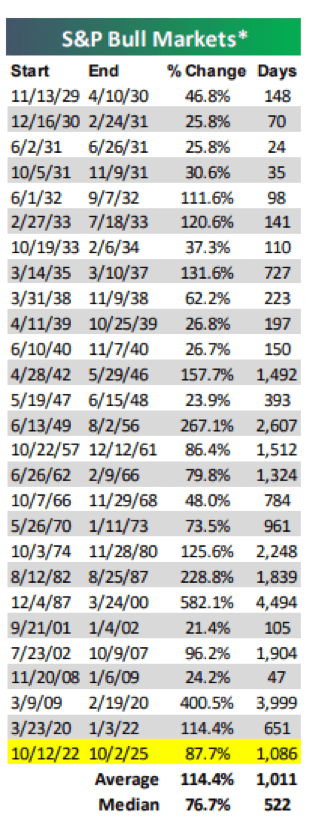
Source: Bespoke Investment Group
You can see the average bull market duration has been over 1,000 days with the S&P 500 more than doubling.
While we are already there on duration, there’s still a way to go before we catch up to the average 114% gain of previous markets.
So stick with it for the ride!
Sign Up Today for Free!
Truth & Trends brings you market insights and trading tips you won't find anywhere else — unless you have your own personal hedge fund manager on speed dial...
Meet Enrique Abeyta, one of Wall Street’s most successful hedge fund managers. With years of experience managing billions of dollars and navigating the highs and lows of the financial markets, Enrique delivers unparalleled market insights straight to your inbox.
In Truth & Trends, Enrique shares his personal take on what’s moving the markets, revealing strategies that made him a star in the world of high finance. Whether it’s uncovering the next big trend or breaking down the hottest stocks and sectors, Enrique’s insights are sharp, actionable, and proven to work in any market condition.
Inside these daily updates, you’ll gain:
- 50 years of combined trading wisdom distilled into actionable insights.
- A behind-the-scenes look at how Wall Street pros spot opportunities and avoid pitfalls.
- Exclusive strategies that Enrique personally uses to deliver exceptional returns — no fluff, just results.
To have Truth & Trends sent directly to your inbox every weekday, just enter your email address below to join this exclusive community of informed traders.
Don’t miss your chance to learn from one of the best in the business.
Sign up now and take your trading game to the next level.
The Leverage Trap: A Painful Lesson in Risk
Posted October 17, 2025
By Greg Guenthner

4 Hard Truths for a Parabolic Market
Posted October 16, 2025
By Enrique Abeyta

Death By Greed: Silver Edition
Posted October 14, 2025
By Ian Culley

Everyone Loves the Rally…. Except the Data
Posted October 13, 2025
By Enrique Abeyta

The “Forgotten Stepchild” Precious Metal Is Waking Up
Posted October 05, 2025
By Ian Culley